About AMSATSA RF Noise Monitoring System
This is the RF Noise Monitoring Mater server for AMSATSA Noise Monitoring project.
This system consists of several remote stations, running a Linux operating system either on a Raspberry Pi or on a laptop with an RTL dongle, recording HF noise at the moment.
The Linux Remote stations will record RF Noise in 1 Mhz bandwidth blocks from 1 Mhz to 30Mhz, generate local graphs and will also send the data to the master server which is this server.
Radio Amateurs that want to be part of this project can get the required equipment and the register their station on this master station.
Getting Started
Remote Station Software
The remote station software is available from giga Technology
There is a Raspberry Pi 3 SD card img file Version 1 of the Noise Montoring remote sensing station that siports 8Bit RTL-SDR dongles
There is now a new Rasberry Pi 4 SD card img file Vertion 2 of the Noise Montoring remote sensing station that suport 12bit SDR dongles (using soapy driver)
HF SDR Dongles
The HF SDR Dongles are also available from Giga Technology.
Click here for more information.
Antenna
What antenna do I need for this system? (This is still under discussion at the next SDR Workshop)
Raspberry Pi
More information regarding the remote station on Raspberry Pi is available here.
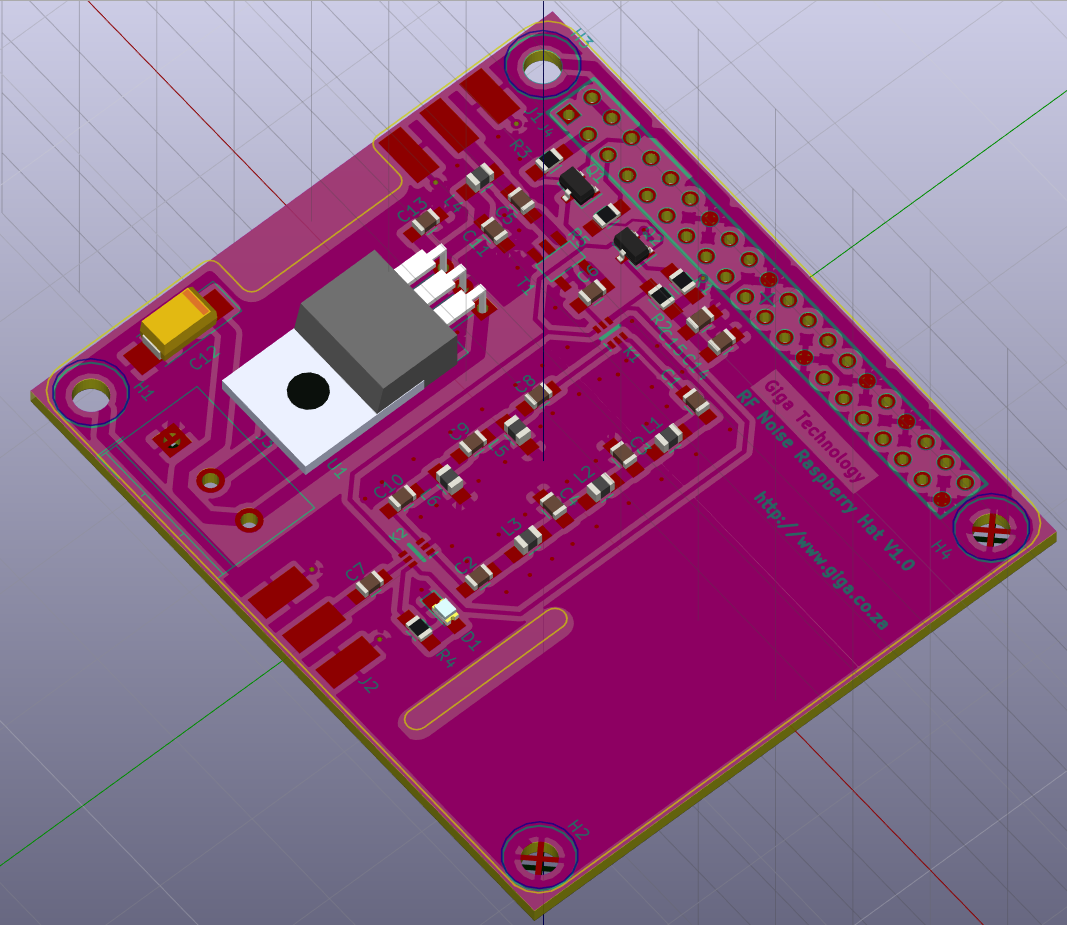
Raspberry Pi Antenna interface and filter Board
This is a Pi Hat board that has a Low and High Pass filter, power injection for Active Antenna with ground Isolation to Raspberry and sdr dongle. More info here.
Bootable USB Memory Stick
More information regarding the bootable USB memory stick with persistence is available here.
Enabling Process Explained
The process to enable your remote station is described in the readme documentation.
How It Works
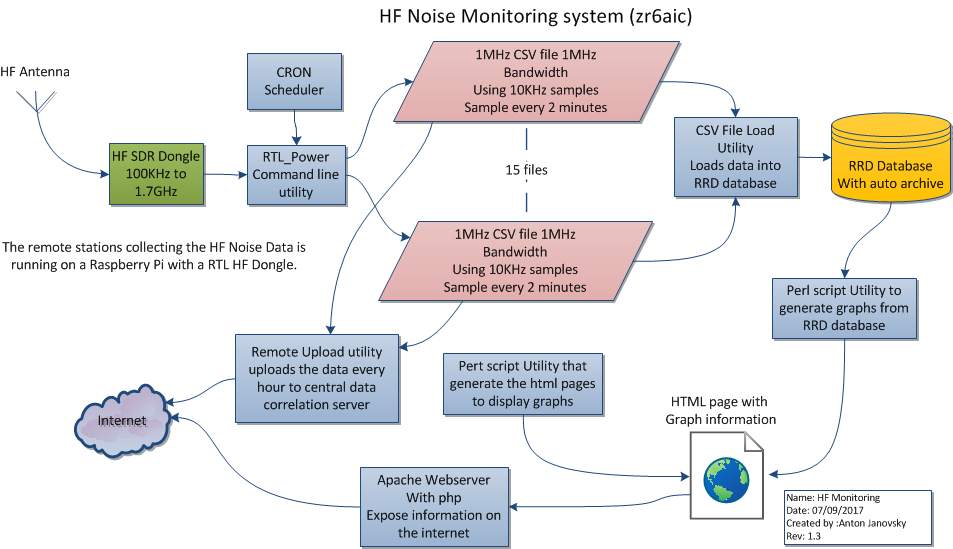
The HF noise monitoring system takes a 12 x 1Mhz bandwidth sample every 2 minutes using the rtl_power utility and saves the measurements in a CVS file.
The 2-minute scheduling is done with a Crontab calling a script in the hf_noise directory. The RF Samples are taken at a 1Mhz bandwidth from 1M to 30Mhz, therefore 29 of the CVS files are created and gets appended as the measurements are made.
A Perl script utility is executed from a CRON scheduler to read the 29 CSV files and import their data into an RRD database.
The RRD database then gets interrogated by another Perl script scheduled by a CRON job to generate the graph images and HTML files and get saved in the Apache web server graph directory which is then exposed on the local link http://localhost/hf_noise/graph/1Mhz_Power.php
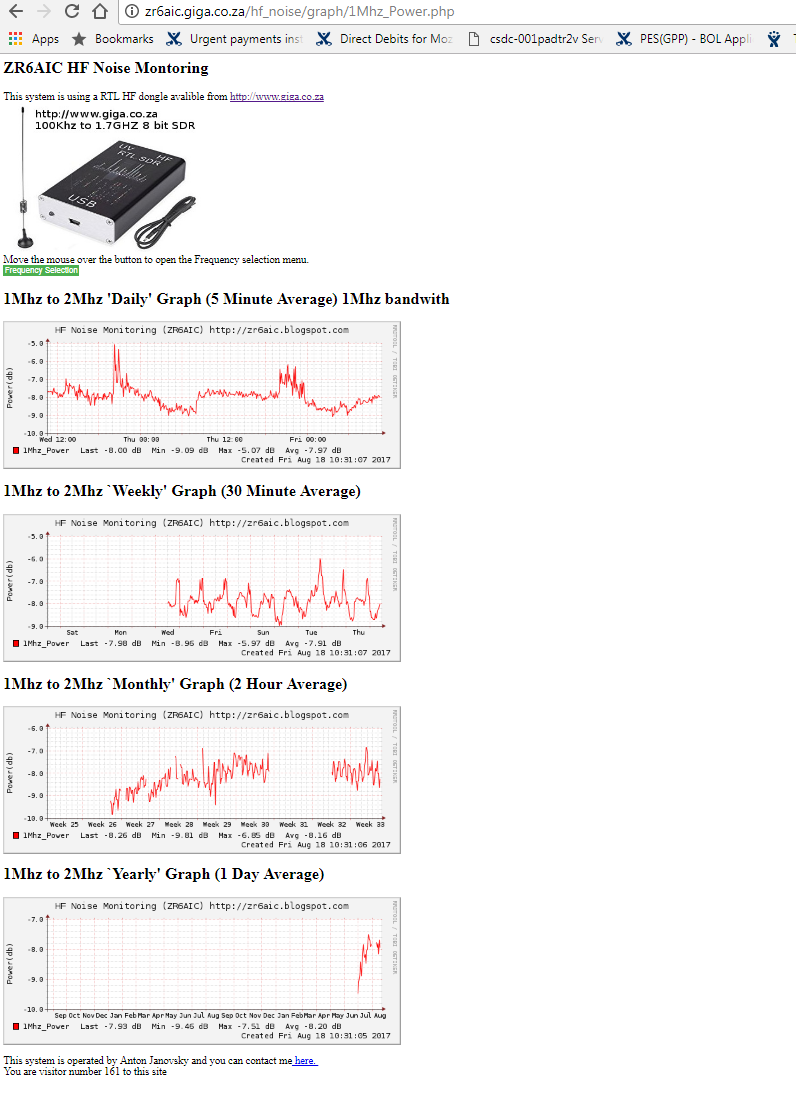
Link to the live system http://zr6aic.giga.co.za/hf_noise/graph/1Mhz_Power.php
Screenshot of Remote sensing stationi
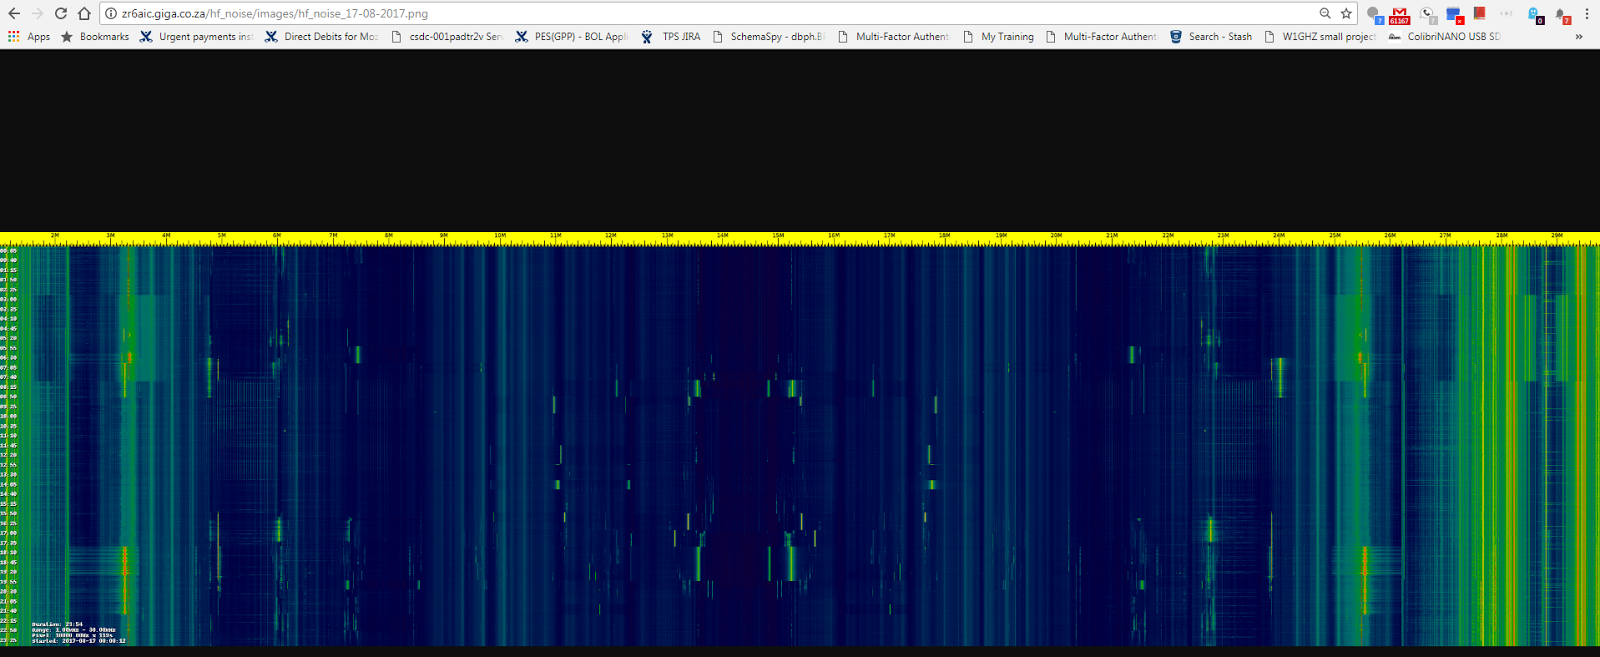
Screenshot of heatmap of band of interest per day (click on image to see details)
The RRD database will then create the Hourly, Daily, Weekly, Monthly and Yearly averages and then generate the graphs every 2 minutes according to the parameters passed to the database.
The generated graphs are then displayed in a PHP page via an Apache web server with a PHP plugin on the following URL http://localhost/hf_noise/graph/1Mhz_Power.php.
Trends can then be seen on the graphs over time.
The heat map is generated by a Python script from different CSV files and is saved in the /var/www/hf_noise/images directory and can be accessed on the local web server on the following URL http://localhost/hf_noise/images.
Link to the live system http://zr6aic.giga.co.za/hf_noise/images/
Video explaning how system works
This system was developed and is administered by Anton Janovsky ZR6AIC Contact me here
Address:
AMSATSA
P O Box 90438
Garsfontein
0042
Gauteng
South Africa
.jpg)